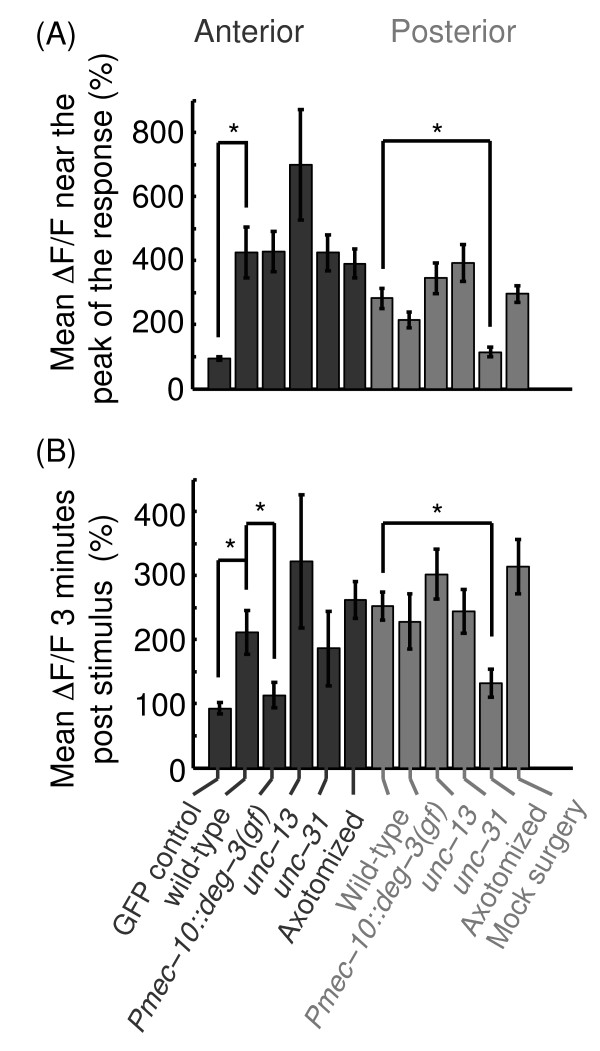
Figure 2.
A comparison of ALA physiological responses to picking-touch. (A) The mean GCaMP fluorescence during the 20 seconds surrounding peak activity, t=5-25 sec and t = 40–60 sec post-stimulus for anterior and posterior stimuli, respectively. Asterisks denote that the measurements of GFP (control) fluorescence and the post-surgery responses to posterior stimuli were significantly different from the corresponding wild-type responses (p<0.05). (B) The mean GCaMP fluorescence at t = 160–180 sec. Asterisks denote that the measurements of GFP (control) fluorescence, the responses in Pmec-10::deg-3(u662) animals , and the post-surgery responses to posterior stimuli were both significantly different from the corresponding wild-type responses (p<0.05). All mean fluorescence levels were calculated from the datasets shown in Figures 1, 5, 7, and 8.

