Figure 3.

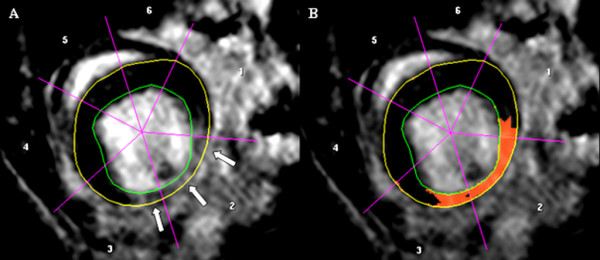
Representative imaging example of endo-and epicardial contour delineation for the assessment of myocardial scar amount. White arrows indicate infarcted region (A). Red-coloured overlay represents segmented myocardial scar tissue (B).

Representative imaging example of endo-and epicardial contour delineation for the assessment of myocardial scar amount. White arrows indicate infarcted region (A). Red-coloured overlay represents segmented myocardial scar tissue (B).