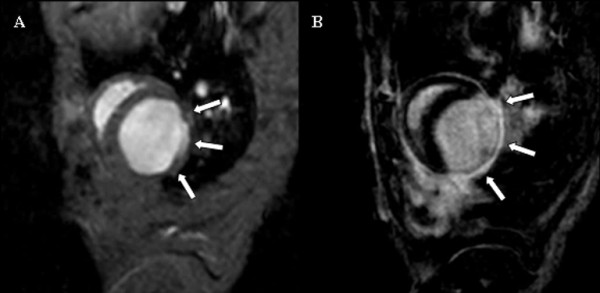
Figure 4.

Comparison of cine and late enhancement imaging (identical slice geometry). Representative example showing an end-diastolic cine short-axis frame (A) and the corresponding late enhancement image (B). White arrows indicate the akinetic (A) and infarcted region (B); see also movie 1 (see additional file 1).
