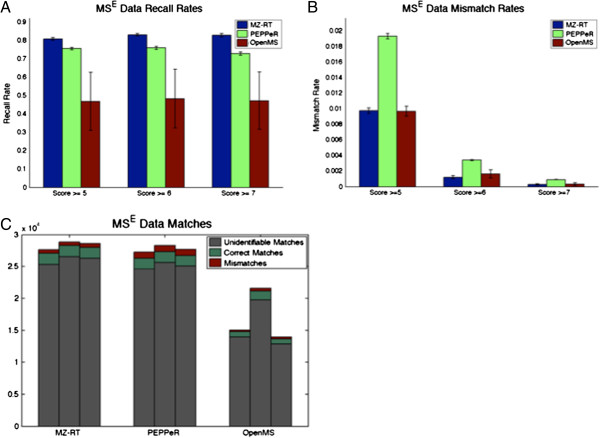
Figure 2.

Comparison with PEPPeR and OpenMS. Panel A shows the recall rates for the MSEE. coli lysate data, considering identifications having peptide score 5, 6, and 7 or greater, for our method, OpenMS, and PEPPeR. Panel B shows the mismatch rate for the MSEE. coli lysate data, considering identifications having peptide score 5, 6, and 7 or greater. The mismatch rate is computed as the number of mismatches (pairwise match with conflicting identifications) divided by the total matches. Panel C shows a bar plot of all correct, incorrect and unidentifiable matches for each method. Unidentifiable matches are pairwise matches where neither peptide has a putative peptide sequence, and so the accuracy cannot be inferred.
