
Figure 3.
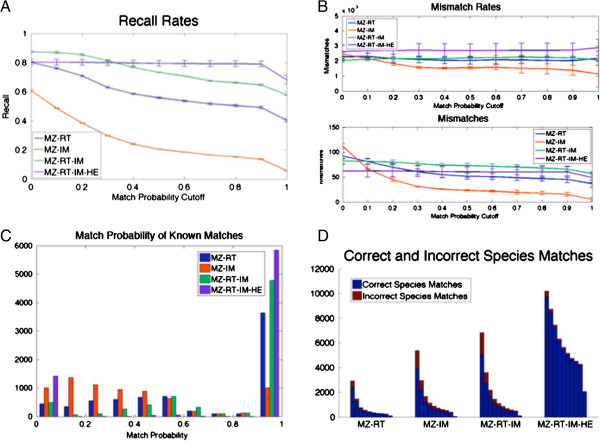
Alignment results using various data characteristics. Panel A shows the recall rates for the HDMSEE. coli lysate data, considering identifications having peptide score 5 or greater, for each of the four alignments across a range of match probability cutoffs. Panel B shows the number and rate of mismatches for the HDMSEE. coli lysate data, considering identifications having peptide score 5 or greater, obtained for each of the four alignments, across a range of match probability thresholds. Panel C shows a histogram of the match probabilities of all shared identifications having peptide score 5 or greater, for each of the four alignments of the E. coli lysate data. For the decoy analysis, Panel D shows the number of matches made to the correct species, and the number of matches made to the incorrect species for each of the four alignments, across a range of match confidence. Each group of stacked bars indicates the number of correct and incorrect matches for the indicated alignment type, for increasing match confidence thresholds from 0.1 to 1 in 0.1 intervals.