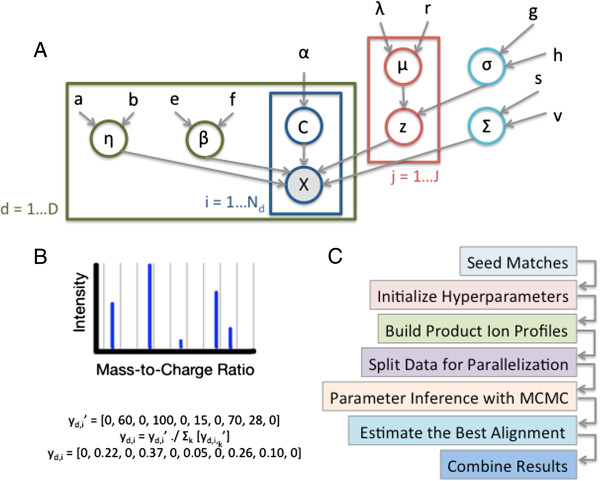
Figure 4.

Alignment algorithm steps and principles. Panel A shows a Plate Diagram of the DPGMM Peptide-Level Model. Panel B illustrates the computation of a product ion profile with a small example of profile size K=10. Panel C gives an overview of the alignment algorithm steps.
