Figure 5.
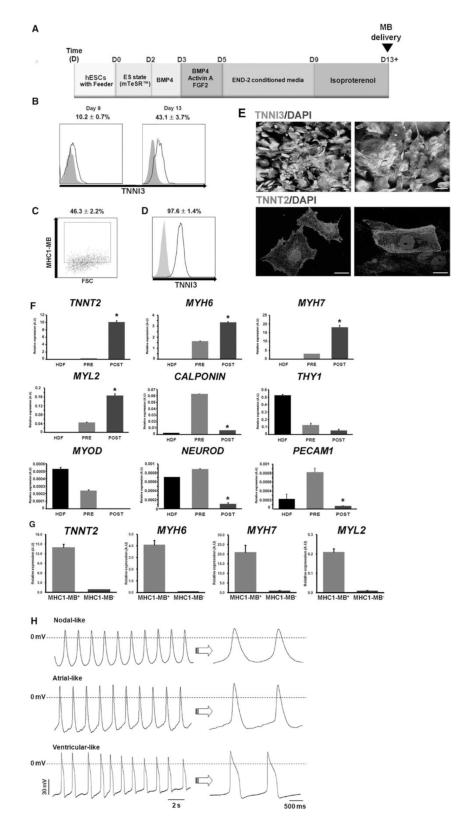
Purification of cardiomyocytes from differentiating hESCs by cell sorting via MB and FACS. (A) A schematic of the protocol to differentiate hPSCs to the cardiac lineage. (B) Percent expression of TNNI3 at day 9 and 13 determined by flow cytometry during hESC differentiation into CMs. N = 3. (C) Flow cytometry results of MHC1-MB-positive cells in hESC differentiation culture at day 13. N = 6. (D) Flow cytometry results showing TNNI3 expression of FACS-sorted hESCs at day 13 of differentiation after applying MHC1-MB. The numbers represent the percentages of MB-positive cells (C, D). N = 3. (E) Immunocytochemistry for TNNI3, and TNNT2 on MHC1-MB-positive cells sorted from hESC cultures. Scale bars, 20 μm. (F) mRNA expression levels of cardiac and non-cardiac genes measured by qRT-PCR. Comparisons were made for HDF, pre-sorted hESCs at day 13 and post-FACS sorted cells at day 13 using MHC1-MB. CM genes (TNNT2, MYH6, MYH7 and MYL2) were significantly higher in the sorted hESCs compared to the pre-sorted hESCs and HDF. Expression of the non-cardiac lineage genes (PECAM1, CALPONIN, THY1, MYOD and NEUROD) was significantly lower in the sorted cells compared to others. Y axis represents relative mRNA expression of target genes to GAPDH. *P < 0.05 compared to pre-sorted group. N = 3. (G) mRNA expression levels of cardiac genes from both MHC1-MB positive and negative cells measured by qRT-PCR. (H) Action potentials of the MHC1-MB-positive CMs. Shown are representative configurations of the nodal- (top), atrial- (middle), and ventricular (bottom) action potentials.

