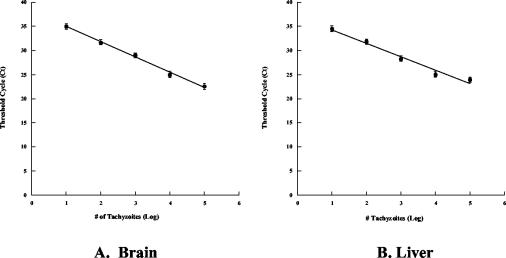
FIG. 8.
Standard curves for quantitative real-time PCR. The standard curves were generated by amplification of the SAG1 sequence from DNA samples extracted from known numbers of infected tachyzoites added to normal chick liver or brain tissue. The curves are plots of the threshold cycle numbers versus log10 normalized numbers of tachyzoites for the brain (A) and liver (B).

