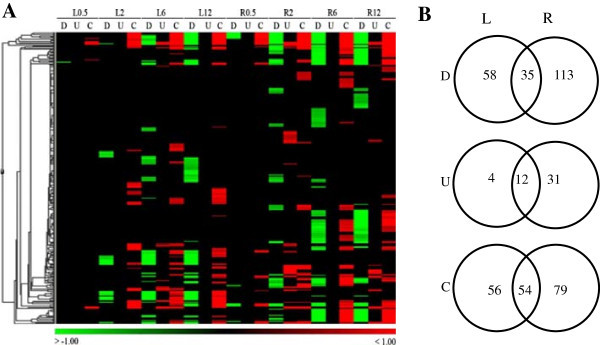
Figure 2.

Enriched biological process in leaves and roots of rice during acute dehydration. (A) Gene Ontology terms are represented by color lines in Hierachical clustering. Terms that are up-regulated or changed are red, down-regulated are green. (B) Total number and overlap GOs between leaves and roots are shown in the Venn diagram. D, U, and C: down, up and change. L/R0.5, 2, 6, 12: leaf/root at 0.5, 2, 6 and 12 h of stress treatment.
