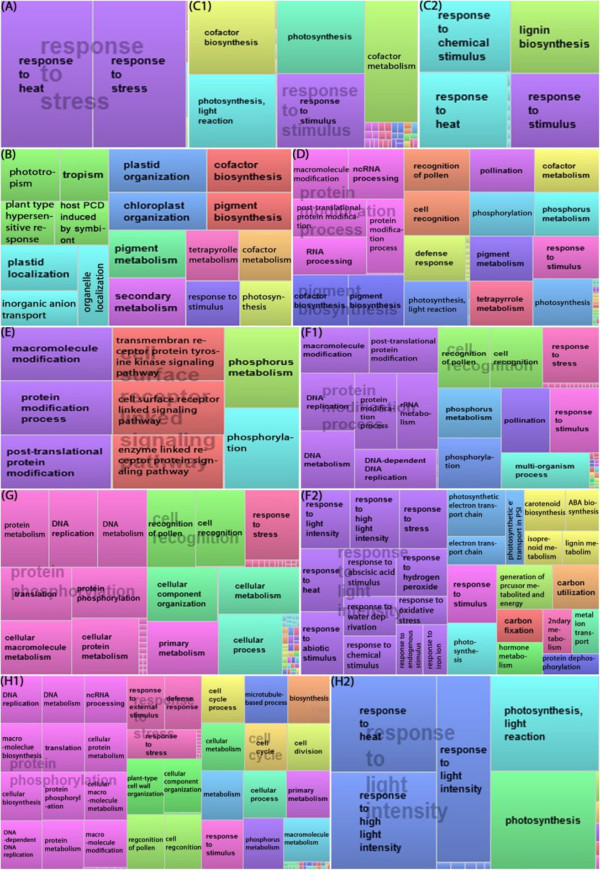
Figure 3.

TreeMap view of GO terms in rice leaf and root. Each rectangle is a single cluster representative, equal to a GO term. The representatives are joined into “superclusters” of loosely related term, visualized with different color. Size of the rectangles are adjusted by –log10 (p-value). Color and size are not related by time point and mode (i.e. color and size in A are different of those in B, those in B are different in C1, ect). A. L0.5_C, B. L2_D, C1. L6_D, C2. L6_U, D. L12_D. E. R0.5_D, F1. R2_D, F2. L2_U, G. R6_D, H1. R12_D, H2. R12_U. L/R0.5, 2, 6, 12: leaf/root at 0.5, 2, 6, 12 h after the onset of treatment; respectively. U, D, C: up, down, change GO terms; respectively.
