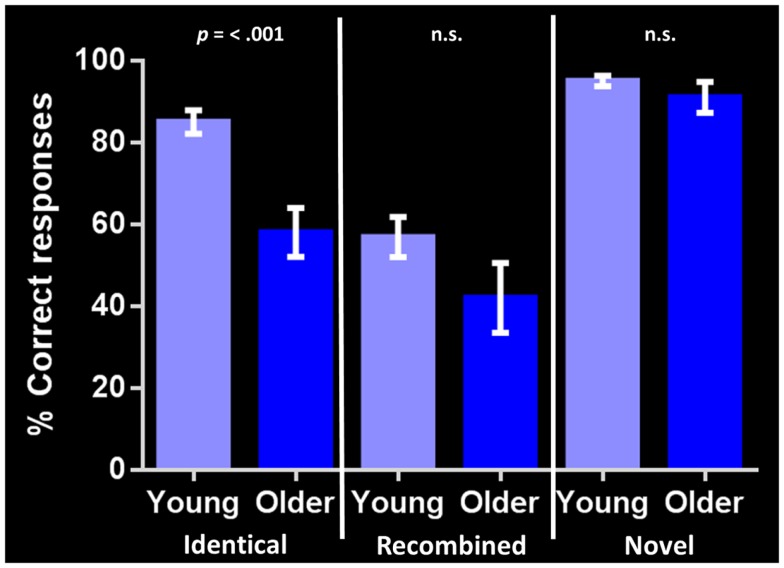
Figure 2.
Corrected recognition memory performance for each stimulus condition in young and older adults (i.e., hits-false alarms). The bar chart shows the percent correct response for each stimulus type (identical, recombined, novel). Error bars represent the standard error of the mean. p = < 0.001 indicates significant difference between young and older adult groups. n.s., indicates non-significant difference.

