
Figure 2.
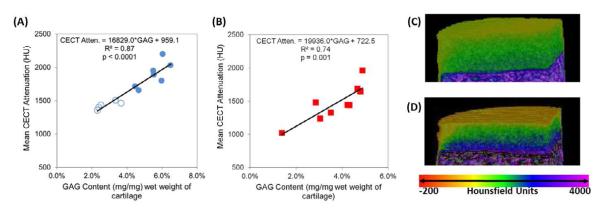
Correlations between CECT Attenuation (HU) and GAG content (mg/mg) of cartilage samples for (A) CECT vs. E samples (Group 1, unfilled data points indicate degraded samples) and (B) CECT vs. μ samples (Group 2). Both correlations were strong (coefficients of variation greater than or equal to 0.74) and statistically significant (p≤0.001). Color maps of representative, non-degraded samples with (C) low (2.86%) and (D) high (4.88%) GAG contents.