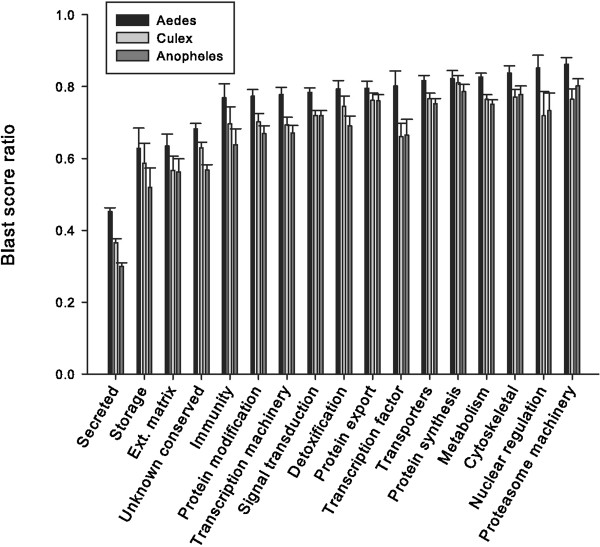
Figure 7.
Comparison of Psorophora albipes protein sequences to those of Aedes aegypti (black square symbol), Culex quinquefasciatus (dark gray symbol), and Anopheles gambiae (SlateGray square symbol) by blastp score ratio. The bars and lines represent the average ratio and standard error calculated by dividing the score of the best-matching mosquito protein and the self-score of the protein for the functional categories indicated in the abscissa. For details, see text.

