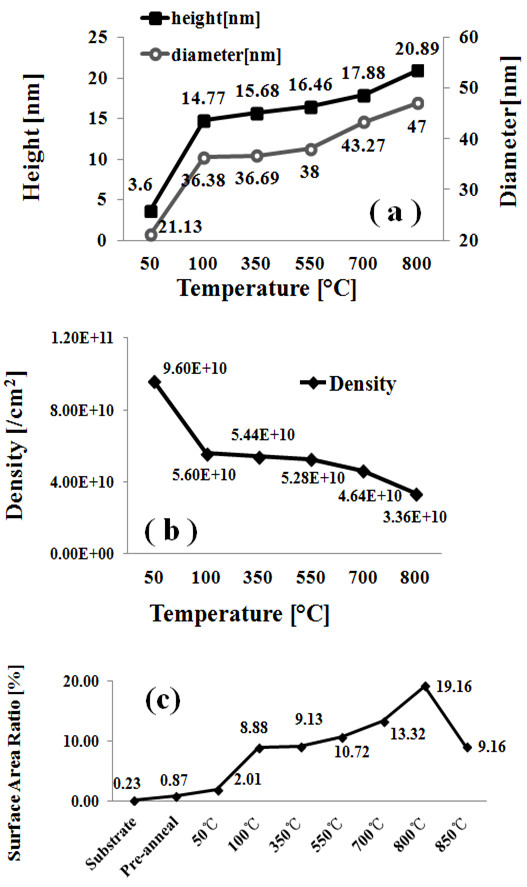
Figure 4.

Plots of AH, LD, AD, and surface area ratios of each sample. (a) Plot summarizing the AH and LD of resulting self-assembled Au droplets at each annealing temperature. (b) Plot showing the AD of Au droplets. (c) Plot showing the surface area ratios of each sample, defined as [(Surface area − Geometric area)/Geometric area] × 100 (%).
