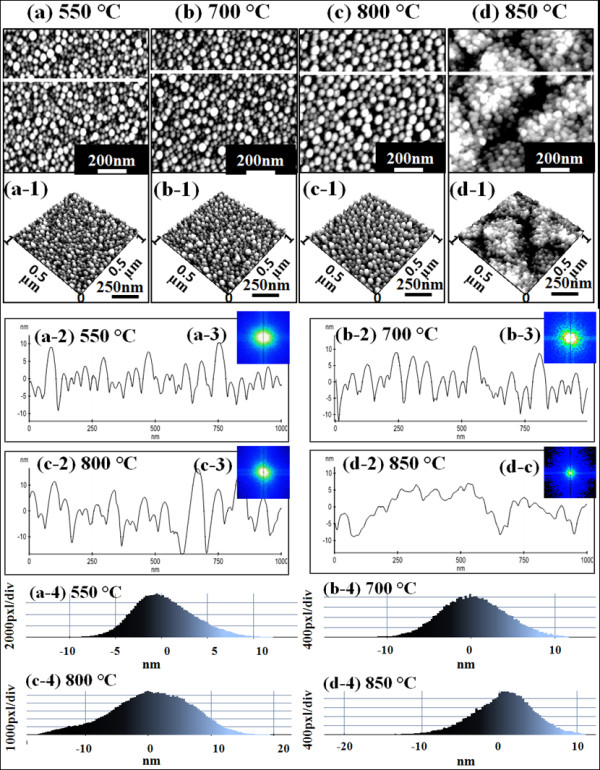
Figure 5.

Annealing temperature variation between 550°C to 850°C with 2-nm Au deposition for 30 s. (a) to (d) are AFM top views and (a-1) to (d-1) show AFM side views of 1 × 1 μm2 areas. (a-2) to (d-2) show the cross-sectional surface line profiles, (a-3) to (d-3) are the 2-D FFT power spectra, and (a-4) to (d-4) are the height distribution histograms.
