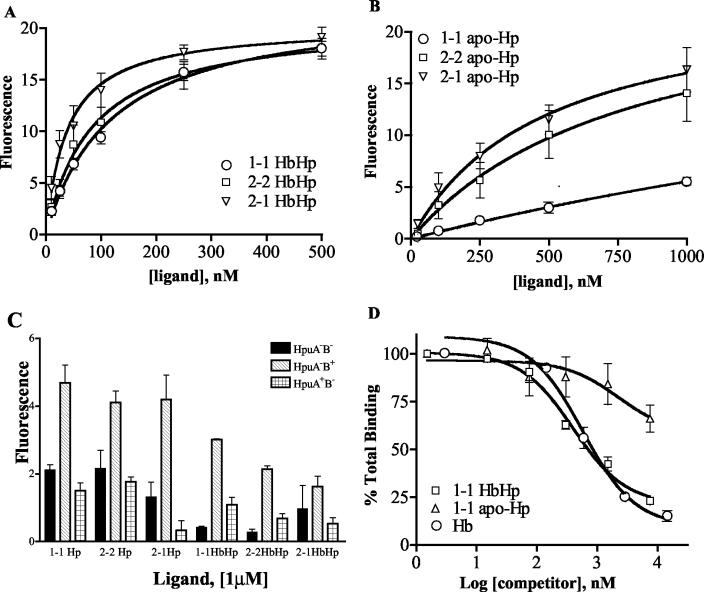
FIG. 3.
(A) Kinetics of binding of types 1-1, 2-2, and 2-1 HbHp to strain DNM140 (HpuA+B+). The data are presented as described in the legend to Fig. 2. The data for each ligand represent the mean of at least three independent experiments conducted in duplicate (total of six data sets per data point on the graph). (B) Kinetics of binding of types 1-1, 2-2, and 2-1 apo-Hp to strain DNM140. As above, data presented are the mean of three separate assays in which each sample was assayed in duplicate. (C) Binding of all three apo-Hp and HbHp phenotypes to DNM68 (HpuA−B−), DNM69 (HpuA−B+), and DNM143 (HpuA+B−). The height of each bar represents the amount bound on incubation of cells with 1 μM each fluorescein-labeled ligand. (D) Ability of Hb and apo-Hp to compete with HbHp for binding to strain DNM140. Cells were mixed with 150 nM FEX-labeled type 1-1 HbHp and 1.5 nM to 7.5 μM unlabeled competitors (type 1-1 HbHp, type 1-1 apo-Hp, and Hb). Results are expressed as the percentage of total binding, with 100% binding determined from control samples to which no competitor was added. Each data point represents the mean of two independent assays, with each sample assayed in duplicate.

