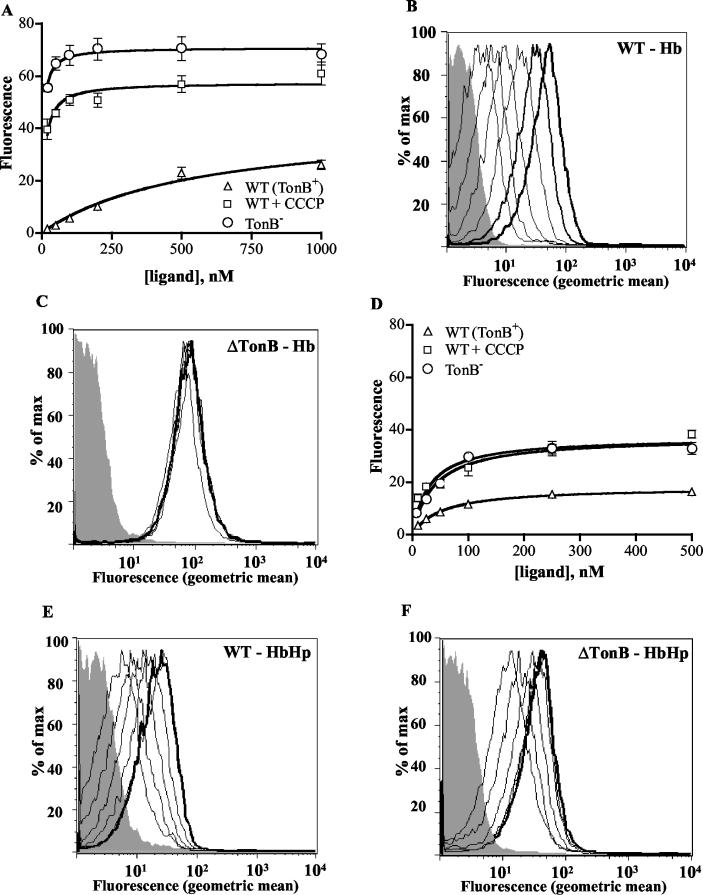
FIG. 4.
Hb and HbHp binding to deenergized HpuAB. The data are presented as described in the legend to Fig. 2. Each data point represents the mean of two independent experiments conducted in duplicate. (A) Isotherm of Hb binding to wild-type (DNM140) and deenergized (DNM146) HpuAB. (B) Flow cytometry histogram depicting FEX-Hb binding to TonB+ DNM140. From left to right, peaks correspond to unstained control (grey) and 20, 50, 100, 200, 500, and 1,000 nM Hb. (C) Flow cytometry histogram of FEX-Hb binding to TonB− DNM146. The shaded grey peak is the fluorescence of the unstained negative control. Ligand was added at same concentrations as used for the experiment panel B. (D) Isotherm of type 1-1 HbHp binding to wild-type and deenergized HpuAB. (E) Histogram of flow cytometry analysis of HbHp binding to DNM140. Left to right, fluorescence peaks of unstained control (grey) and 10, 25, 50, 100, 250, and 500 nM ligand. Note that the 250 and 500 nM (bold) peaks are superimposed. (F) Histogram of type 1-1 HbHp binding to DNM146. Ligand was added at same concentrations as used for the experiment in panel E. Fluorescence peaks of the 100, 250, and 500 nM (bold) samples are superimposed.

