Fig. 3.

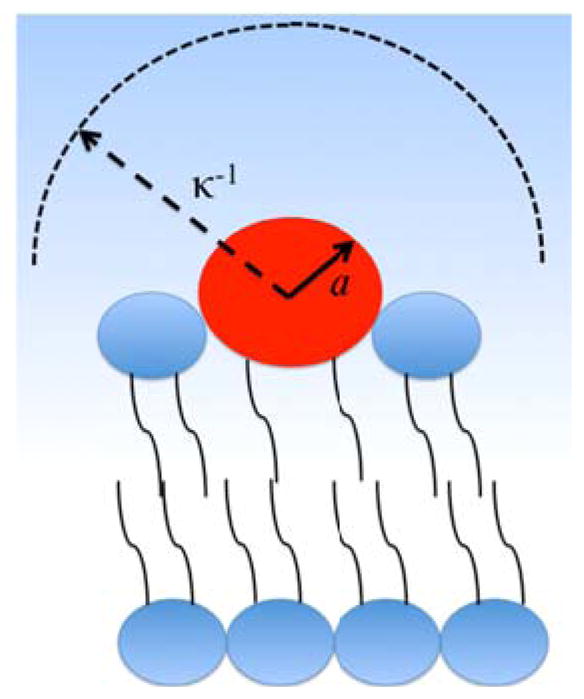
Schematic diagram of a charged lipid head group (red ball) in a lipid bilayer. The radius of the head group, a, and the Debye length, κ−1, of the surrounding aqueous solution are shown for the case where aκ<1.

Schematic diagram of a charged lipid head group (red ball) in a lipid bilayer. The radius of the head group, a, and the Debye length, κ−1, of the surrounding aqueous solution are shown for the case where aκ<1.