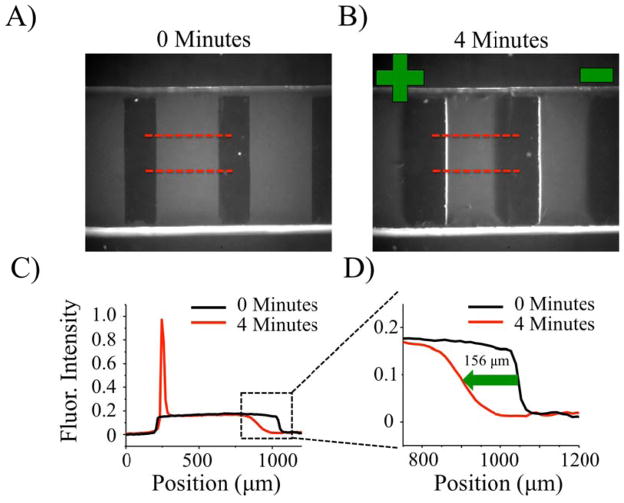
Fig. 5.
Fluorescent micrographs of a patterned POPC bilayer containing 0.1% ortho- Texas Red DHPE (A) before and (B) after a four-minutes of electrophoresis with an 86.7 V/cm field at pH 4.9. The positions of the positive and negative electrodes relative to the SLB are shown in green in (B). (C) The corresponding line profiles averaged over the area between the dotted red lines. The initial line profile is in black and the one after electrophoresis is in red. (D) A blow-up of the region within the black dashed-line region in (C).

