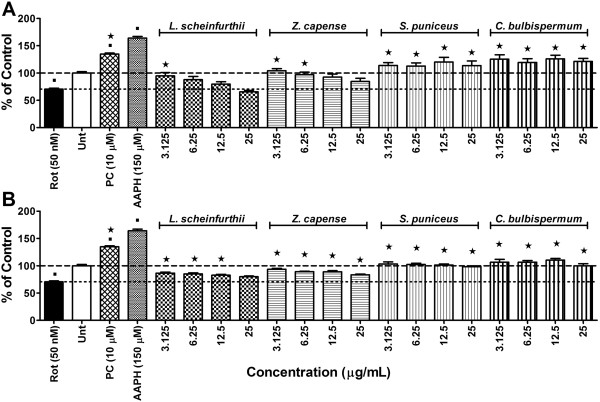
Figure 2.
Effects on radical generation. Intracellular ROS levels in SH-SY5Y cells exposed to rotenone at 50 nM after 1 h pre-treatment with either A) methanol or B) ethyl acetate plant extracts following 24 h exposure period. Significant differences from the rotenone are indicated by * representing p value < 0.05, while significant differences from vehicle controls are indicated by ■, also representing p value < 0.05. PC = positive control (minocycline at 10 μM); Rot = rotenone; Untr = Vehicle controls. (The dashed-line indicates ROS levels in the vehicle controls while the dotted-line is indicative of ROS generation exposed to rotenone alone.

