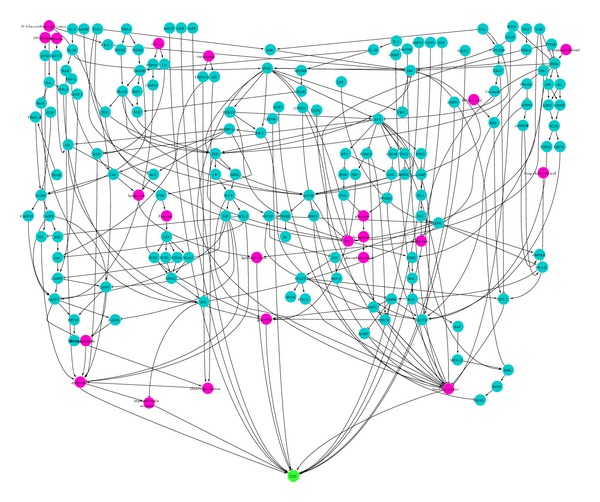
Figure 3.

Biological network of T2D. Blue circle node: protein; purple circle node: nonprotein node; green octagon nodes: type 2 diabetes; “→”: one node enables the expression of the next node, raises the expression, or enhances the activity of the next node; “⊣”: one node inhibits the expression of the next node, lowers the expression, or weakens the activity of the next node.
