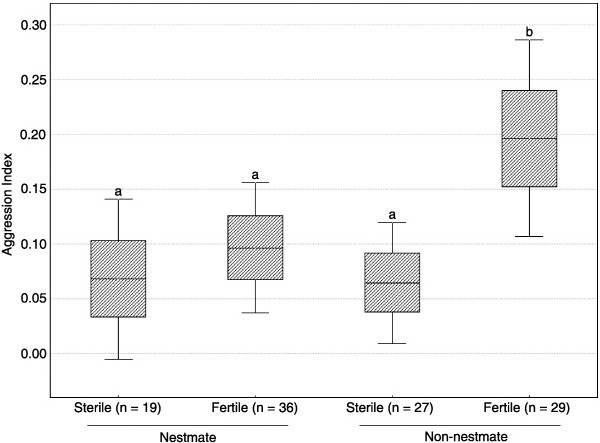
Figure 2.
Aggression indexes of guards during dyadic encounters according to the type of introduced workers. Each encounter (n = 111) lasted 5 minutes. Box plots represent mean ± SE and 95% confidence interval. The different letters denote statistical differences after post-hoc REGW comparison procedure.

