Figure 2.
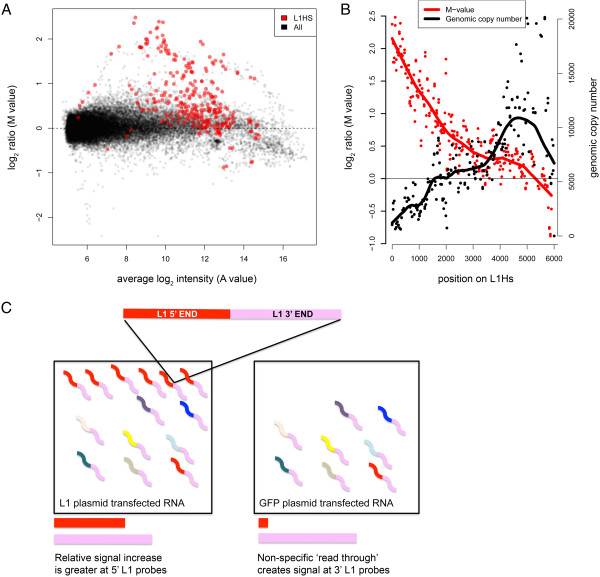
Exogenous L1 transfection experiment. A) Shown is an MA plot of TE array signals from L1 transfected HeLa cells as compared to untransfected cells. The y-axis shows the M value (log2 ratio) for each probe; the x-axis shows the A value, which is the average of the log2 intensities from the two channels. Black dots represent all TE probes. Red dots represent L1HS probes (Homo sapiens-specific L1). The L1 probes detect elevated transcript abundance from cells with the L1 plasmid. B) L1 expression map. M values are shown relative to probe positions as they occur along the length of a full-length, 6 kb, LINE-1. The highest signal is detected using probes at the 5′ end of the element, whereas the 3′ end has relatively similar signal transfected and control cells (red line). Overlaid is a graph depicting genomic copy number of L1Hs sequences relative to their position in the L1Hs consensus (black line). Copy number increases along the length of the L1 consensus sequence until the 3′ end; here, divergences of the 3′UTR sequence that distinguish young L1 subfamilies from older L1 sequences occur, and the smoothed curve is drawn downward. C) This graphic shows how the M value is greatest in probes mapping to the 5′ end of the L1 (colored red). Since most L1 elements in the genome are 5′ truncated, 3′ end mapping L1 fragments (colored pink) can be incorporated into transcripts of other RNA species (multicolored lines). This is seen in both GFP and L1 transfected cells, whereas, full length L1 RNA copies (5′ is red and 3′ end is pink) are abundant in L1 transfected cells. The lengths of the horizontal red and pink bars below represent the abundance of 5′ and 3′ L1 RNAs respectively.

