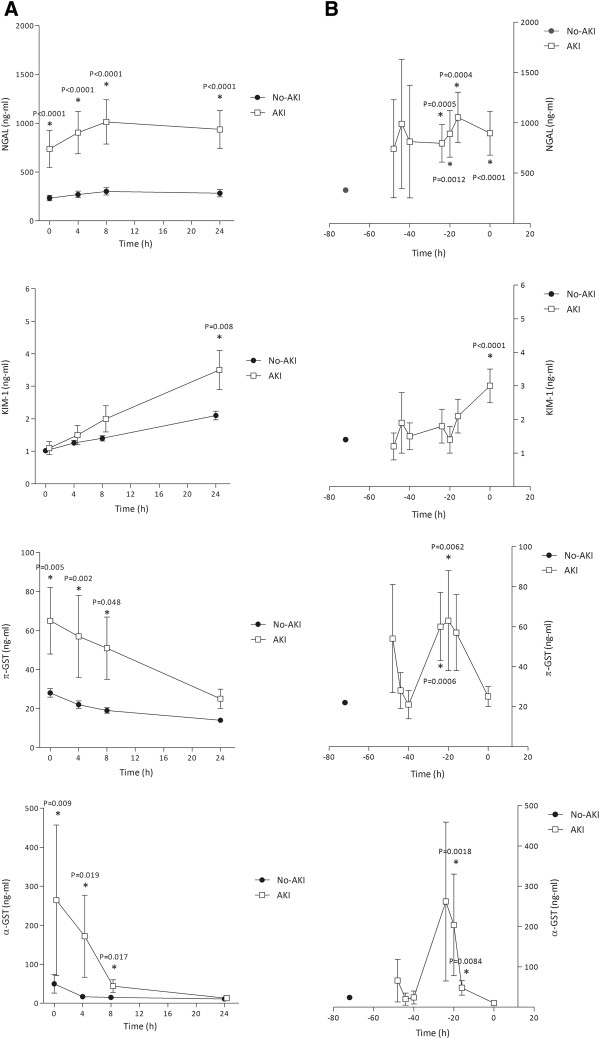
Figure 2.
Biomarker patterns after ICU admission (A) and preceding AKI (B). Biomarker concentrations are expressed in ng/ml and data represent the mean (standard error of the mean; SEM). NGAL: Neutrophil gelatinase-associated lipocalin; KIM-1: Kidney injury molecule-1; GST: glutathione-S-transferase; AKI: acute kidney injury. Mean biomarker concentrations in AKI patients vs. non-AKI patients at each time-point were compared using the Mann–Whitney U test (A) and the mean biomarker concentrations in AKI patients were compared to the pooled mean value of all available non-AKI measurements using the Mann–Whitney U test (B). Panel A represents the un-recoded data plotted against the time following ICU admission. Panel B represents the recoded data prior to the rise in SCr.

