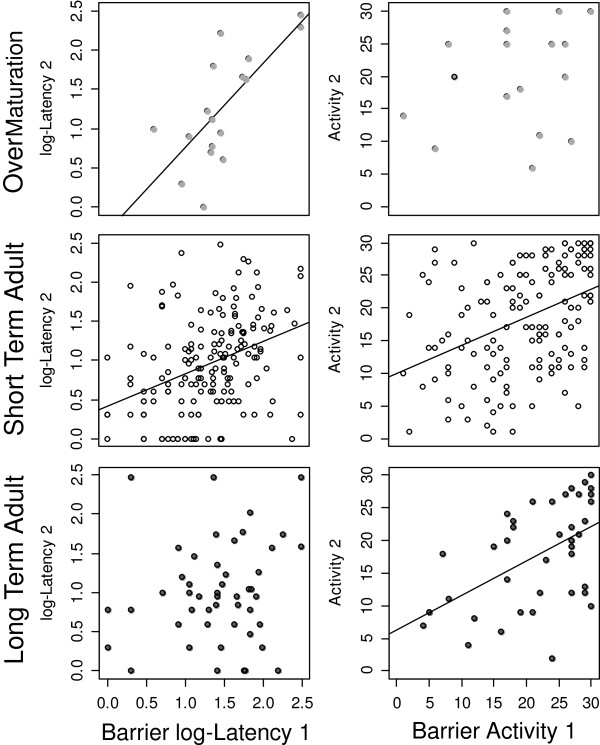
Figure 2.
Correlation between behavioural variables measured in first and second barrier-test. Latency (left side; range 0–300 sec.) and activity (right side; max. 30 active samples) for each of the three experimental groups of tested common voles are shown. Correlations coefficient (rs) and p-values for correlations are represented in Table 1. Lines indicate significant correlations (p < 0.05; adjusted for multiple testing).

