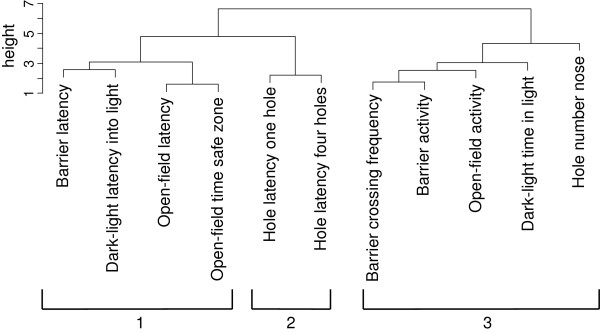
Figure 3.

Dendrogram for the relationships between measured variables in the ‘short term adult’-group (N = 168) according to the cluster analysis. Height of each U represents the distance between two variables and is based on correlation coefficients of Spearman correlation matrix (see Additional file 1). Groupings indicate possible behavioural syndrome structure (agglomerative coefficient 0.64).
