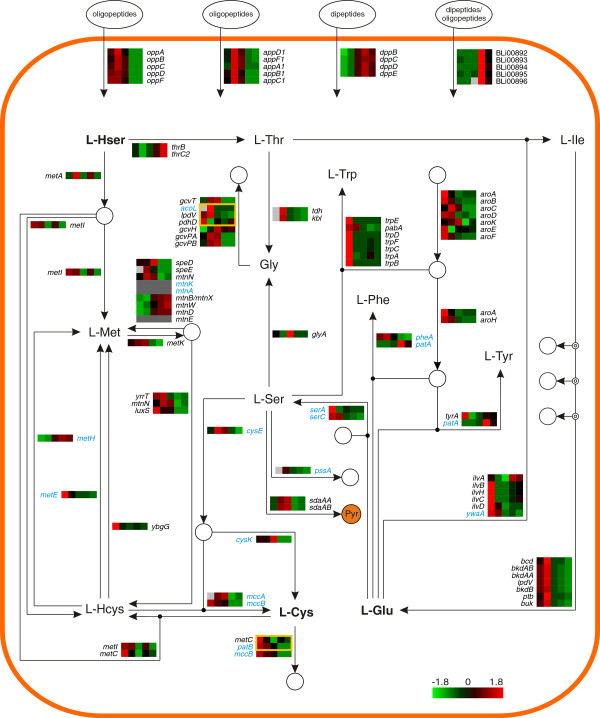
Figure 5.
Transcriptome of the amino acid metabolism - Part I. Heat map representation of Z-score transformed NPKM values of genes involved in amino acid transport and metabolism (see also Figure 6). Genes with an assigned antisense RNA [25] are marked in blue, genes with NPKM values <10 at all sampling points are indicated by dark grey boxes and statistically not significant values are indicated by light grey boxes. Amino acids written in bold can also be found in Figure 6. Yellow frames indicate reactions with multiple assigned enzymes of which only one is strictly necessary. Pyr: Pyruvate. For the corresponding proteome data please refer to Additional file 1: Figure S2.

