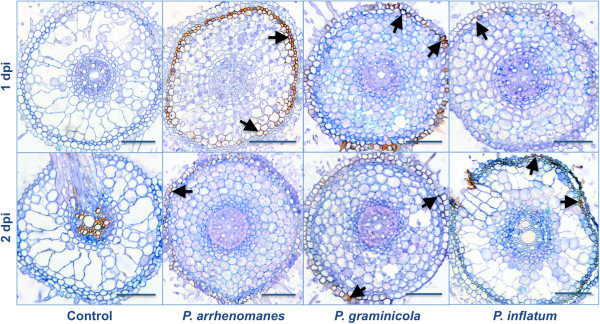
Figure 3.

H202 production in Pythium-inoculated rice roots at 1 and 2 dpi. Arrows indicate reddish-brown DAB precipitates. Samples were taken from the most heavily infected parts of the primary root (upper 1.5 cm) and infiltrated with DAB. After cross sectioning, samples (5 μm) were stained with trypan blue. Scale bars = 100 μm.
