Figure 1.
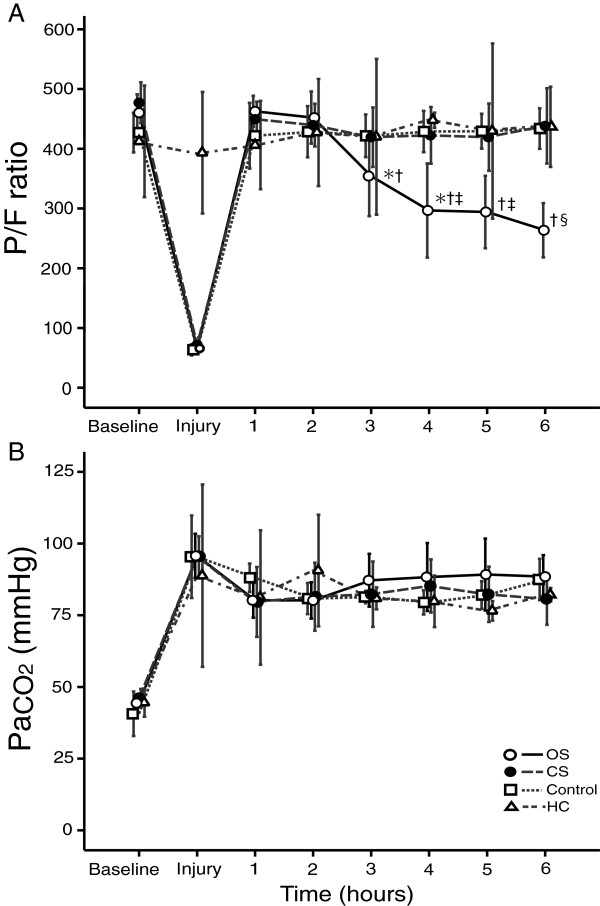
Changes in (A) PaO2/FIO2 (P/F) ratio and (B) PaCO2 in the study groups. OS, open endotracheal suctioning (open circle); CS, closed endotracheal suctioning (closed circle); Control, control group with ARDS, but without endotracheal suctioning (square); HC, healthy control group with 6 hour ventilation, but without ARDS and endotracheal suctioning (triangle). (A) OS group shows progressive decline in P/F, whereas, all other groups maintained at P/F of >400 up to the end of the study. *p < 0.05 vs. compared with previous value within the same group; †p < 0.05 compared with 1 hour after injury within the same group; ‡p < 0.05 vs. CS and Control groups; §p < 0.05 vs. CS, Control and HC groups. Data are shown as means with 95% confidence intervals.

