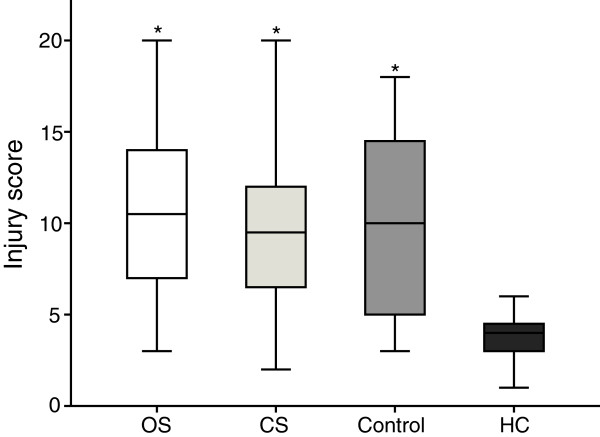
Figure 2.
Box-and-whiskers graph of quantitative histological analysis showing the lung injury score. The ends of the boxes indicate the 25th and 75th percentiles and the lines in the bars indicate the median value. The 10th and 90th percentiles were indicated with whiskers. OS, open endotracheal suctioning; CS, closed endotracheal suctioning; Control, control group with ARDS, but without endotracheal suctioning; HC, healthy control group with 6 hour ventilation, but without ARDS and endotracheal suctioning. *p < 0.05, compared with healthy control (HC) group.

