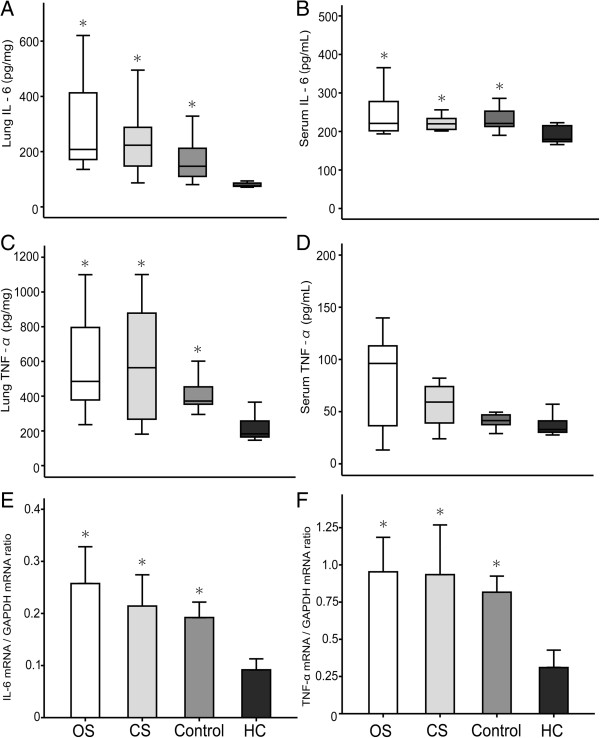
Figure 3.
Expression level of potential inflammatory cytokines as revealed by ELISA and Real Time PCR. Serum and pulmonary levels of interleukin (IL)-6 and tumor necrosis factor (TNF) –α at the end of the study by ELISA (A-D). The mRNA expression of IL-6 and TNF-α at the end of the study by Real Time PCR (E-F). OS, open endotracheal suctioning; CS, closed endotracheal suctioning; Control, control group with ARDS, but without endotracheal suctioning; HC, healthy control group with 6 hour ventilation, but without ARDS and endotracheal suctioning. *p < 0.05, compared with healthy control (HC) group.

