Figure 2.
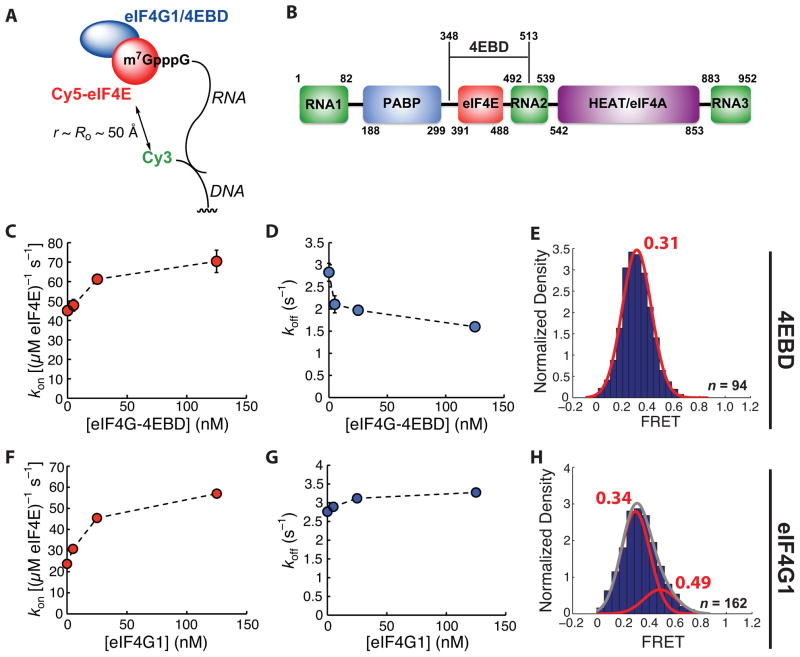
Modulation of eIF4E•cap-poly(CU) binding kinetics by the eIF4G 4E-binding domain and by eIF4G1. (A) Schematic of experimental design. (B) Domain architecture of S. cerevisiae eIF4G1, showing relative positions of RNA-, eIF4E-, Pab1p-, and eIF4A-binding domains, and the region of the protein constituting eIF4E-4EBD. (C) Dependence of Cy5-eIF4E-RNA association rate on eIF4G-4EBD concentration, measured at 7.5 nM Cy5-eIF4E. (D) Dependence of observed rate of dissociation of the Cy5-eIF4E•RNA complex on the concentration of eIF4G-4EBD. (E) Representative FRET distribution for the Cy5-eIF4E•RNA complex (in the presence of 125 nM eIF4G-4EBD), fit to a single Gaussian function. (F) Dependence of Cy5-eIF4E-RNA association rate on full-length eIF4G1 concentration, measured at 7.5 nM Cy5-eIF4E. (G) Dependence of observed rate of dissociation of the Cy5-eIF4E•RNA complex on the concentration of eIF4G1. (H) Representative FRET distribution for the Cy5-eIF4E•RNA complex (in the presence of 125 nM eIF4G1), fit to the sum (grey line) of two Gaussian functions (red lines). The number of single-molecule traces (n) used to construct distributions is given where appropriate. Error bars in kinetic plots represent standard errors for single-exponential fits. See also Figure S2.

