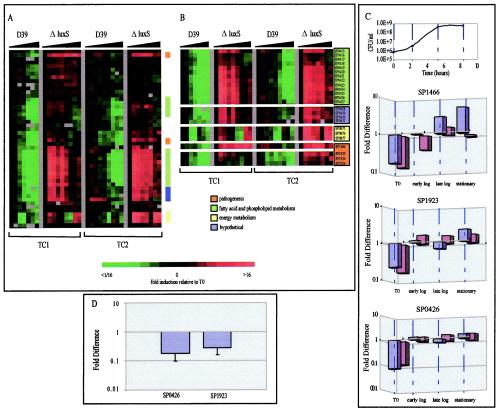
FIG. 1.
The expression profiles of the luxS mutant and the isogenic parent strain over two time courses (TC1 and TC2). (A) Cluster diagram showing the expression profiles of the zero-transformed data for 46 genes from both time courses which met the filter criteria as explained in Materials and Methods. Experiments are organized by increasing time of culture as noted by the black triangles. Cultures were sampled at an initial cell density of 5 × 10⁵ CFU/ml for each strain in TC1 and then at regular periodic intervals thereafter until a density of 4 × 10⁸ CFU/ml was reached. Cultures were similarly sampled for TC2. Initial and final cell densities were 2 × 10⁶ and 6.5 × 10⁸ CFU/ml, respectively. Functional categories are noted and are based on the TIGR4 annotation. (B) A subset of the regulated genes arranged in chromosomal order. Putative operons composed of groups of consecutive genes are shown. (C) The difference in gene expression between mutant and parent strains at various time points for the non-zero-transformed data from SP1466 (putative hemolysin), SP1923 (pneumolysin), and SP0426 (accD), expressed on a log scale. Time zero, early-log, late-log, and stationary-phase time points were chosen. The blue and purple bars represent data from TC1 and TC2, respectively. (D) Real-time RT-PCR results. Differences in gene expression between mutant and parent strains at time zero were confirmed by real-time RT-PCR. RNA was prepared from at least two independent experiments, and the real-time assays were carried out in triplicate. The relative abundance of each message of interest in each sample was normalized to the level of rpoB-specific transcript. The data are depicted as the fold difference of the mutant versus that of the parent for each gene.

