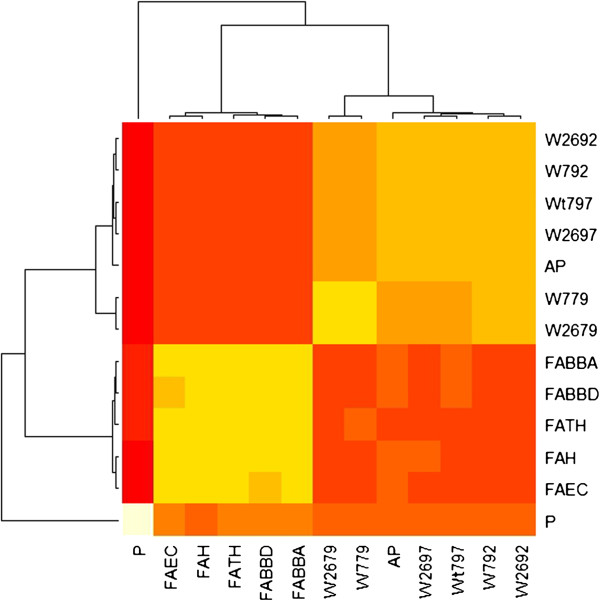
Figure 3.

Heatmap of merged consensus matrix for two clusters. Heatmap showing the similarity within of the two groups of methods: Waltz (denoted by Wxxx, where, for example, Waltz at pH = 2.6 and threshold = 79, was denoted by W2679, and Waltz at pH = 7 and threshold = 79 was denoted as W779), AmylPred (AP), and FoldAmyloid (Fxxxx). Pafig (P) was clustered as a quite different approach. Similarity was calculated using merged distance matrix over different clustering algorithms (agnes, pam, hclust, kmeans, and diana).
