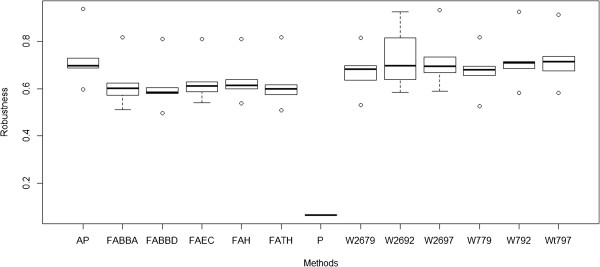
Figure 4.

Box plots showing the robustness values associated with the structures of each of the two cluster outcomes. Each box plot represents the membership robustness values of a method over different consensus clustering algorithms (agnes, pam, hclust, k-means, and diana). The membership robustness is calculated as the average connectivity between the method and all of the other methods of the cluster. While consensus clustering produces more or less identical membership robustness values for all methods but for Pafig, the robustness for Pafig method is noticeably lower reflecting its heterogeneity.
