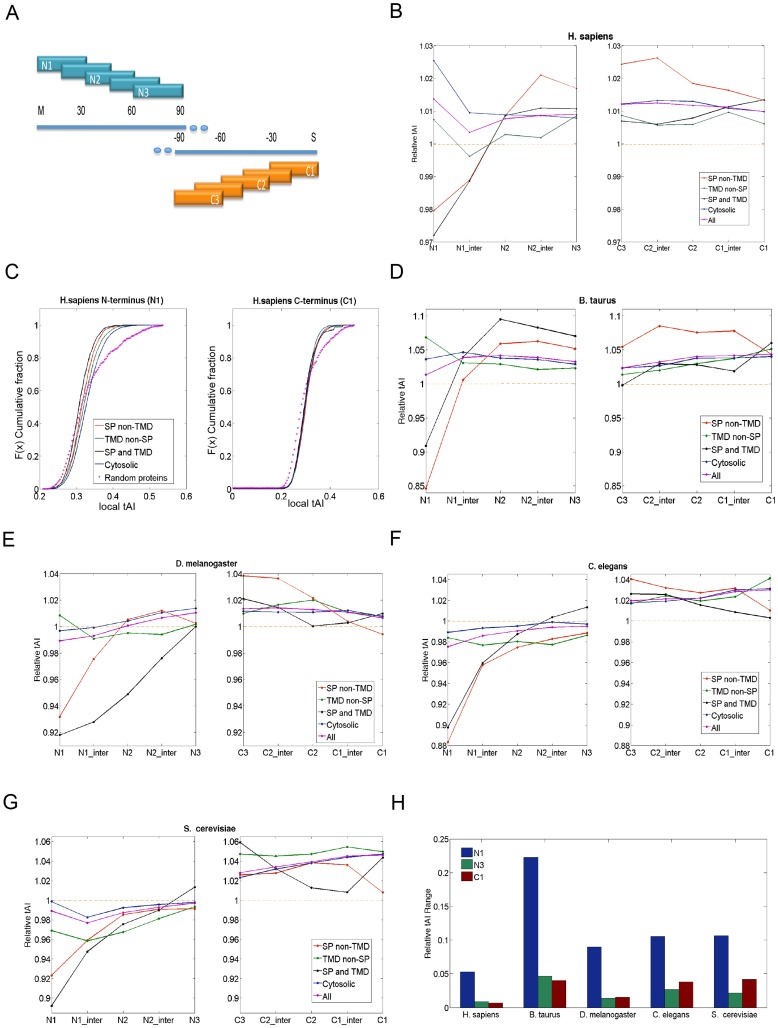
Figure 4. Analysis of local tAI profiles.
(A) A schematic description of the 5 segments, each for 30 codons from the N′-terminal region and the C′-terminal of the coding sequence. (B) Relative tAI profile of the N′- and C′-terminal segments of the human proteome according to 4 group partition (as in Table S2). Each of the protein group is color coded as follows: Red, SP non-TMD; Black, SP and TMD; Green, TMD non-SP; Blue, Cytosolic proteins. Purple, the entire proteome, marked as “All.” Pink asterisks, the random proteins according to length distribution of the proteome. (C) Cumulative distribution of proteins according to the tAI values of the N1 and C1 segments. The data are based on all tAI values that were compiled in (B) for N′- and C′-termini. Note that for the N′-terminal but not the C′-terminal, the cumulative distribution of each of the four protein groups is distinctive. The statistic of the cumulative distribution for human proteome is shown in Table 2. Relative tAI profile for B. taurus (D), D. melanogaster (E), C. elegans (F) and S. cerevisiae (G). (H) The range of relative tAI values of N1, N3, and C1 segments of all tested organisms. The relative tAI range is defined as the highest averaged relative tAI subtracted by the lowest averaged relative tAI value among the four protein groups within the same segment.

