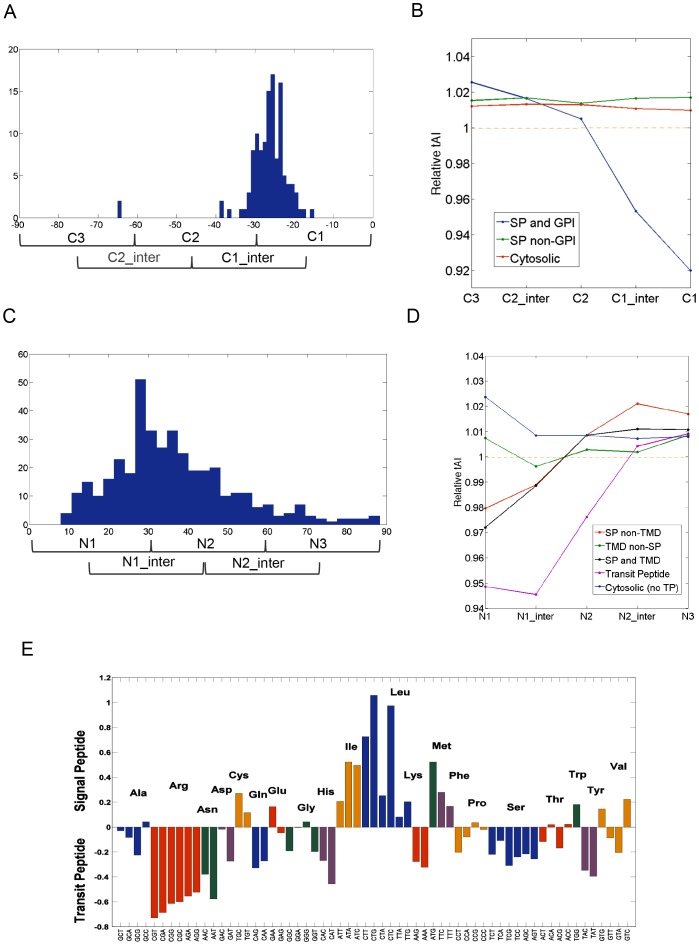
Figure 6. Analysis of the local segmental tAI profiles for GPI-anchored and Transit peptide (TP)-proteins.
(A) Histogram of the cleavage site relative to the end of the coding transcript for GPI-anchored proteins. Length is measured relative to the stop codon. (B) Relative tAI profile at C′-terminal segments for 128 human GPI-anchored proteins at the C′-terminal region. (C) Histogram of the cleavage site relative to the initiator Methionine for the TP-proteins. (D) Relative tAI profile of 499 human TP proteins at the N′-terminal region. (E) Relative codon usage in SP- and TP-proteins. Y-axis scale is the relative codon usage in SP sequences divided by the relative codon usage in the TP sequences. Codons that belong to the same AA are colored as a group.

