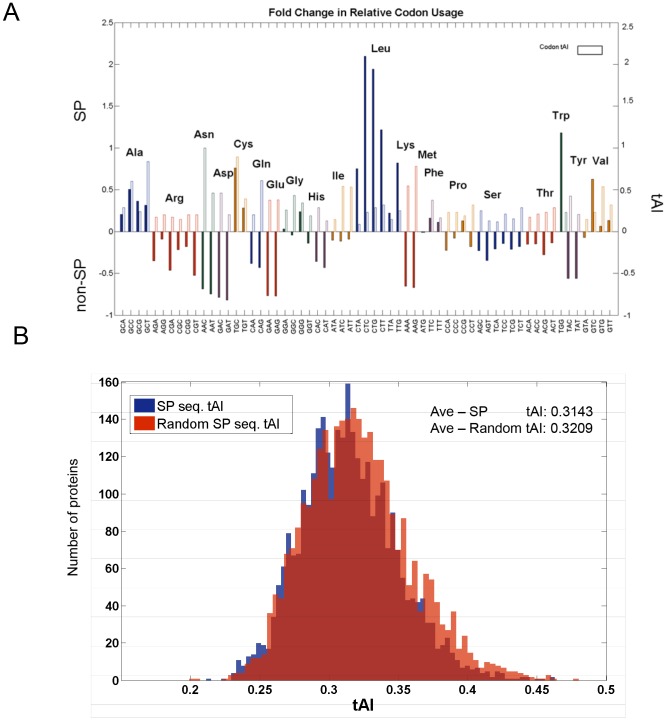
Figure 7. Signal sequence codon usage analysis of the human proteome.
(A). Codon usage fold change in SP versus non-SP proteins. The relative codon usage in signal sequences is divided by the relative codon usage in sequences of same length distribution, originated from non-SP proteins. Y-axis is shown as the fold change subtracted by one marking the codons that are more commonly used and those that are underrepresented in the signal sequences. The values of codon tAI are indicated by the empty frame to indicate the absolute tAI value for each codon (as in Figure 1B). (B). tAI distribution of the original signal sequences (blue) and of the signal sequences in which each codon was randomly replaced by a synonymous one according to their codon usage distribution (red). The significance of the mean values of the two distributions is shown.

