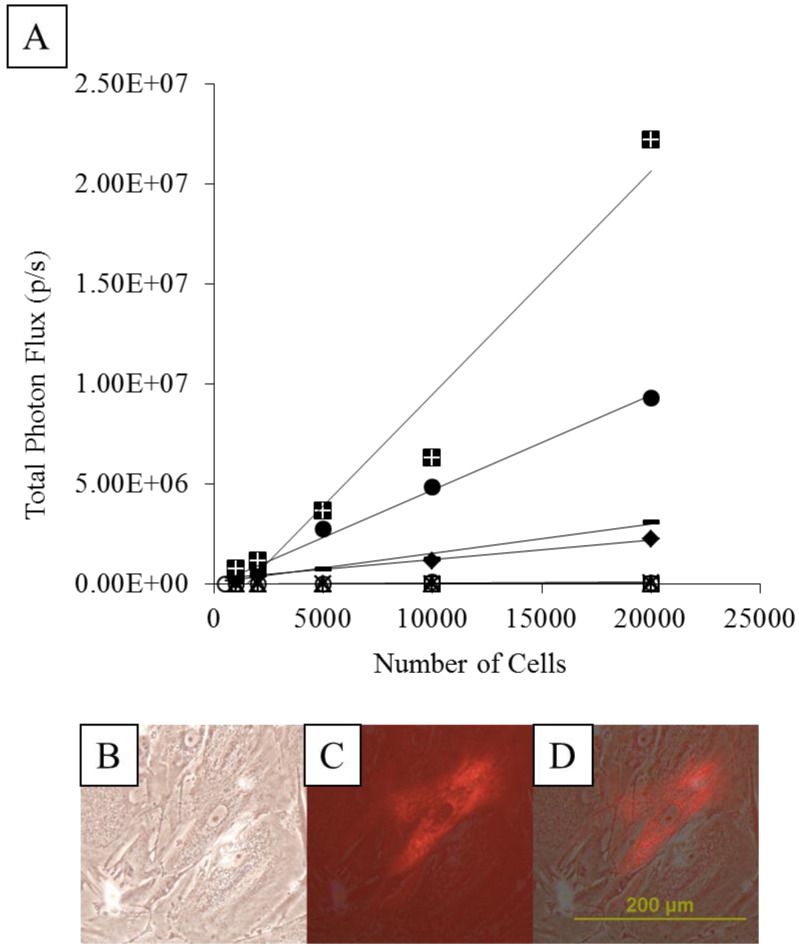
Figure 4.
A: The transfection efficiency based on BLI signal intensity obtained from each transfection for a given number of cells. Different symbols represent cells from different transfection batches. A linear relationship was found but the efficiency varied for each transfection study. B-D: Microscopic images of transfected MSCs expressing red fluorescent protein in bright field (B), fluorescent light (C), and merged composite of B and C (D).

