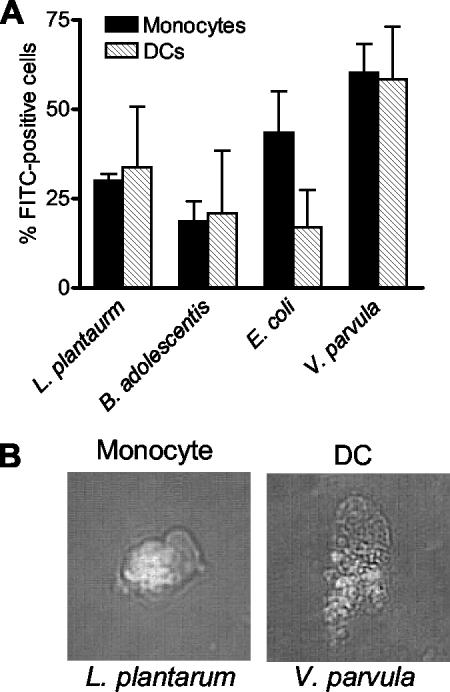
FIG. 3.
(A) Phagocytosis of FITC-labeled bacteria by monocytes and DCs. The bars indicate the mean percentage of FITC-positive cells from three donors, and the error bars indicate the standard error of the mean. (B) Photomicrographs of a monocyte and a DC that have phagocytosed FITC-labeled bacteria. Original magnification, ×400.

