
Figure 3. Decoder tolerance to weight vector deviation.
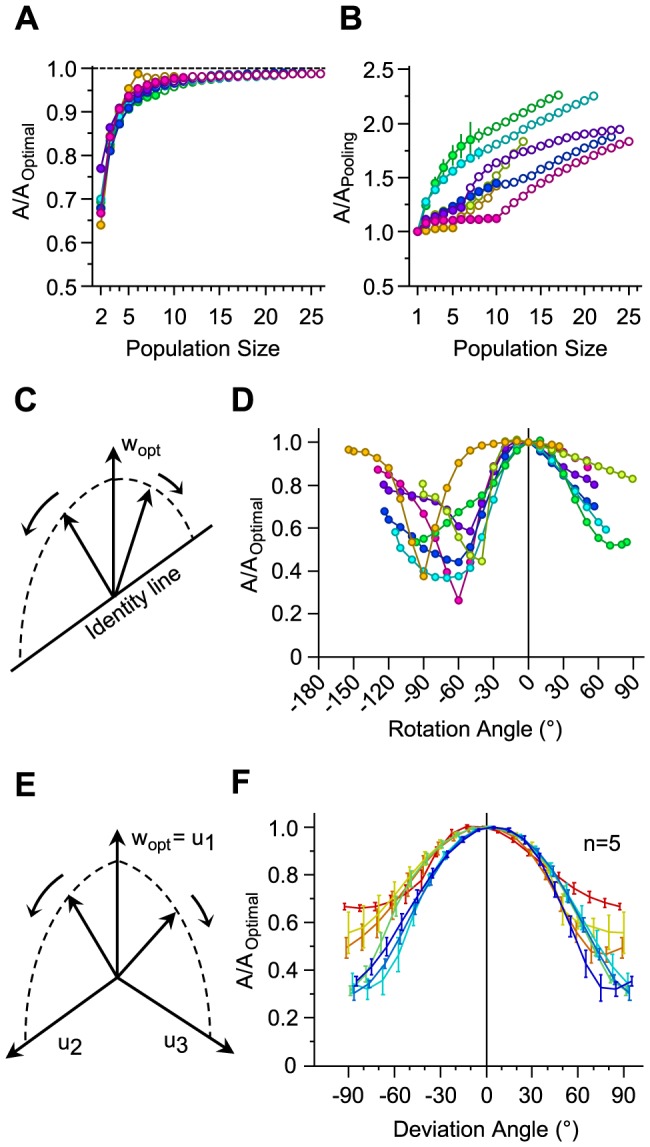
A. The relative decline in the performance of the decoder after dropping a unit by setting its weight to zero. For every population, the performances were calculated and averaged across all possible 1-unit reductions. Plotting conventions are the same as in Figure 2. B. The performance of the decoder after dropping a unit relative to the performance of the pooling of the reduced population. The abscissa represents the size of the population after 1-unit reduction. C. Rotating the weights from the optimal direction towards the identity line which corresponds to pooling. Rotation was performed along two asymmetric paths. D. The relative change in the performance of the decoder when the weight vector was deviated from the optimal direction in steps of 10° towards the pooling direction (identity line). Every session is represented with a color and corresponding data points are connected with a line. The two extreme data points on each curve correspond to the performance of pooling relative to the groupwise-optimal decoder. For every session, the population of all single neurons was considered. E. Systematically rotating the weights from the optimal direction, denoted by  , towards every other dimension in the space of neuronal activities. Dimensions are orthogonal, and span the space of the neuronal activity. The trajectory of this rotation lies on the 2-dimensional plane spanned by the optimal direction and the target dimension, and hence is perpendicular to all other dimensions. F. The relative performance of decoder with a deviated weight vector compared to the optimal direction for all possible populations of 8 neurons averaged across sessions (n = 5). Colors indicate the 7 trajectories toward associated dimensions, with red corresponding to the dimension perpendicular to optimal direction such that it maximizes the separation between neuronal responses, and blue corresponding to the dimension along which the separation between neuronal responses is minimal. Error bars indicate standard error of the means.