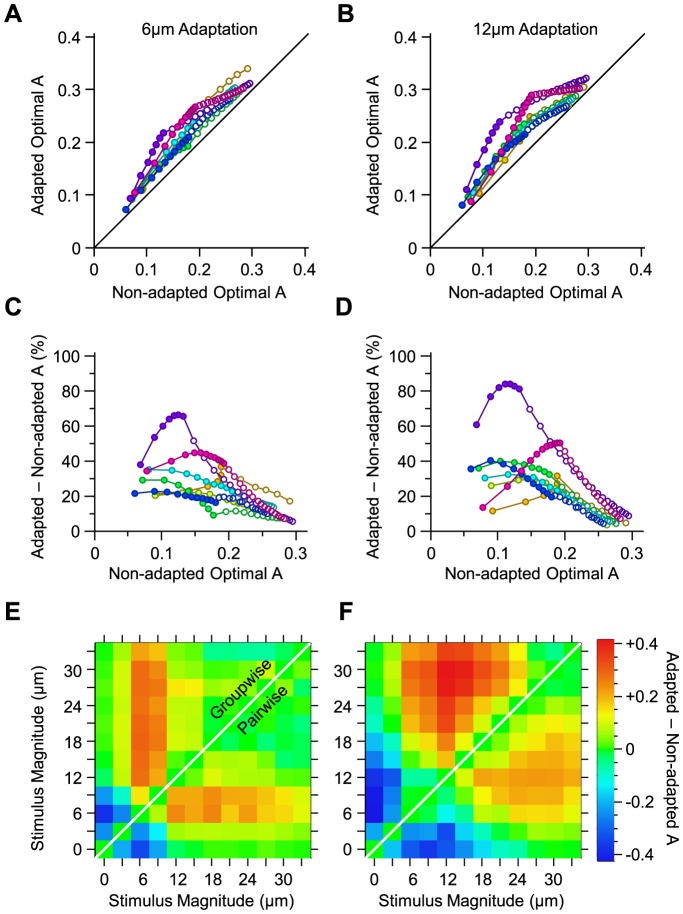
Figure 5. Adaptive optimal decoding.
A. The value of A for the optimal decoder when optimized on population responses under 6 µm adaptation, against the value of A for the optimal decoder when optimized on non-adapted population responses. B. As in A, but for 12 µm adaptation. C. The per cent improvement in the value of A under 6 µm adaptation relative to the non-adapted state. D. As in C, but for 12 µm adaptation. E. The effect of 6 µm adaptation on the value of A for every stimulus pair, in a sample session with 11 simultaneously recorded single neurons, indicated by purple color in A–D. The upper triangle corresponds to the groupwise-optimal decoder, while the lower triangle corresponds to the pairwise-optimal decoder. F. As in E, but for 12 µm adaptation.

