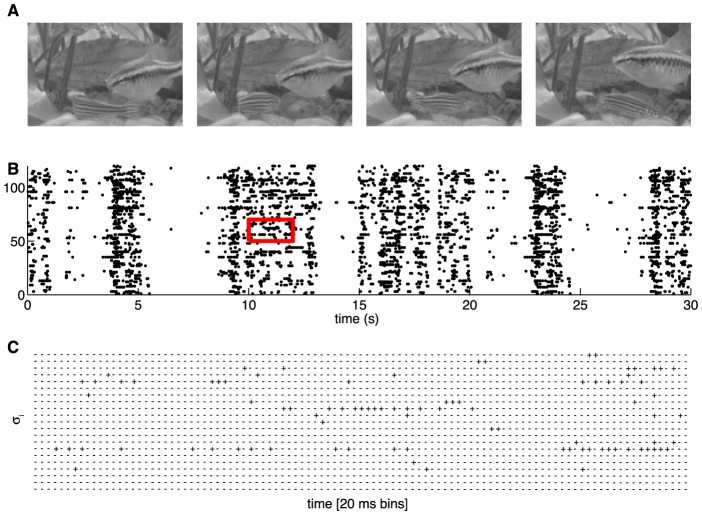
Figure 1. A schematic of the experiment.
(A) Four frames from the natural movie stimulus showing swimming fish and water plants. (B) The responses of a set of 120 neurons to a single stimulus repeat, black dots designate spikes. (C) The raster for a zoomed-in region designated by a red square in (B), showing the responses discretized into Δτ = 20 ms time bins, where  represents a silence (absence of spike) of neuron i, and
  represents a spike.

