
Figure 2. Learning the pairwise maximum entropy model for a 100 neuron subset.
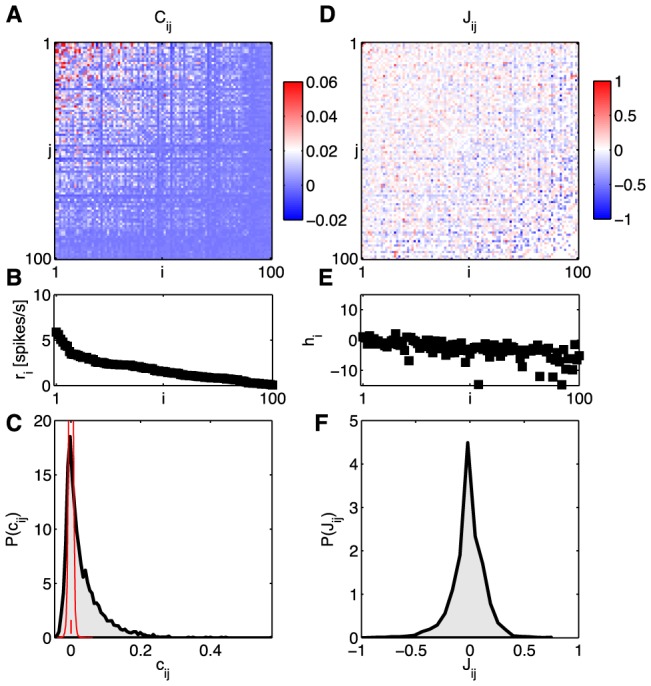
A subgroup of 100 neurons from our set of 160 has been sorted by the firing rate. At left, the statistics of the neural activity: (A) correlations 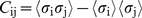 , (B) firing rates (equivalent to
  ), and (C) the distribution of correlation coefficients
  . The red distribution is the distribution of differences between two halves of the experiment, and the small red error bar marks the standard deviation of correlation coefficients in fully shuffled data (1.8×10⁻³). At right, the parameters of a pairwise maximum entropy model [
 from Eq (19)] that reproduces these data: (D) coupling constants
  , (E) fields
  , and (F) the distribution of couplings in this group of neurons.