
Figure 3. Reconstruction precision for a 100 neuron subset.
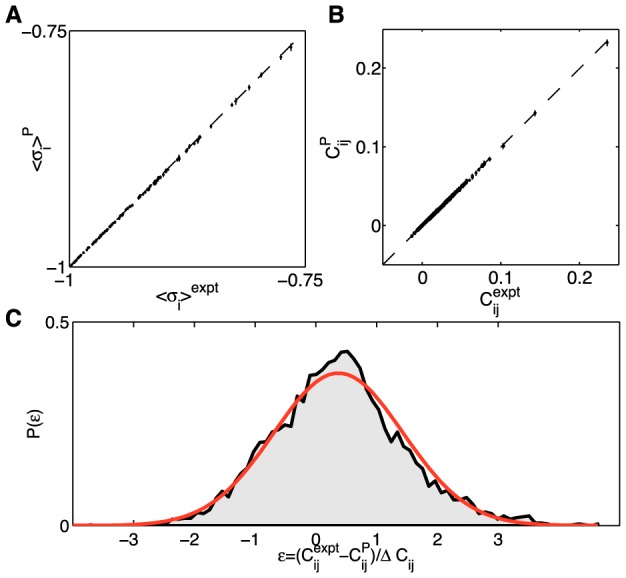
Given the reconstructed Hamiltonian of the pairwise model, we used an independent Metropolis Monte Carlo (MC) sampler to assess how well the constrained model statistics (mean firing rates (A), covariances (B), plotted on y-axes) match the measured statistics (corresponding x-axes). Error bars on data computed by bootstrapping; error bars on MC estimates obtained by repeated MC runs generating a number of samples that is equal to the original data size. (C) The distribution of the difference between true and model values for  covariance matrix elements, normalized by the estimated error bar in the data; red overlay is a Gaussian with zero mean and unit variance. The distribution has nearly Gaussian shape with a width of ≈1.1, showing that the learning algorithm reconstructs the covariance statistics to within measurement precision.