
Figure 4. A test for overfitting.
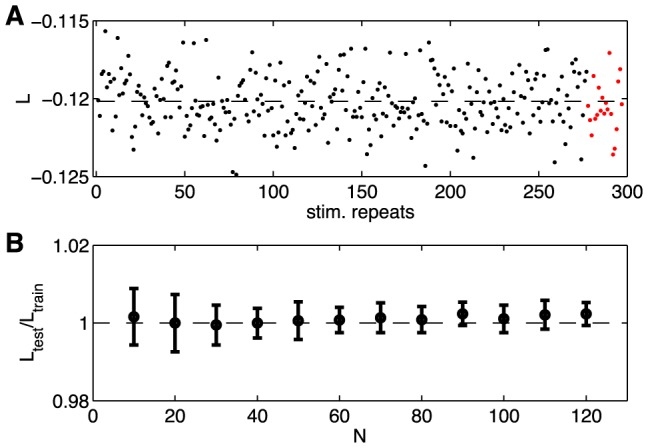
(A) The per-neuron average log-probability of data (log-likelihood, 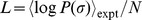 ) under the pairwise model of Eq (19), computed on the training repeats (black dots) and on the testing repeats (red dots), for the same group of N = 100 neurons shown in Figure 1 and 2. Here the repeats have been reordered so that the training repeats precede testing repeats; in fact, the choice of test repeats is random. (B) The ratio of the log-likelihoods on test vs training data, shown as a function of the network size N. Error bars are the standard deviation across 30 subgroups at each value of N.