
Figure 6. K-pairwise model for a the same group of N = 100 cells shown in Figure 1.
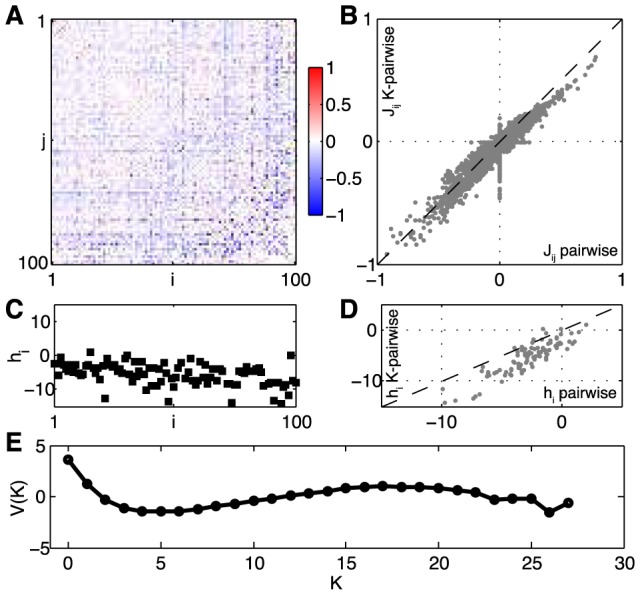
The neurons are again sorted in the order of decreasing firing rates. (A) Pairwise interactions,  , and the comparison with the interactions of the pairwise model, (B). (C) Single-neuron fields,
  , and the comparison with the fields of the pairwise model, (D). (E) The global potential, V(K), where K is the number of synchronous spikes. See Methods: Parametrization of the K-pairwise model for details.