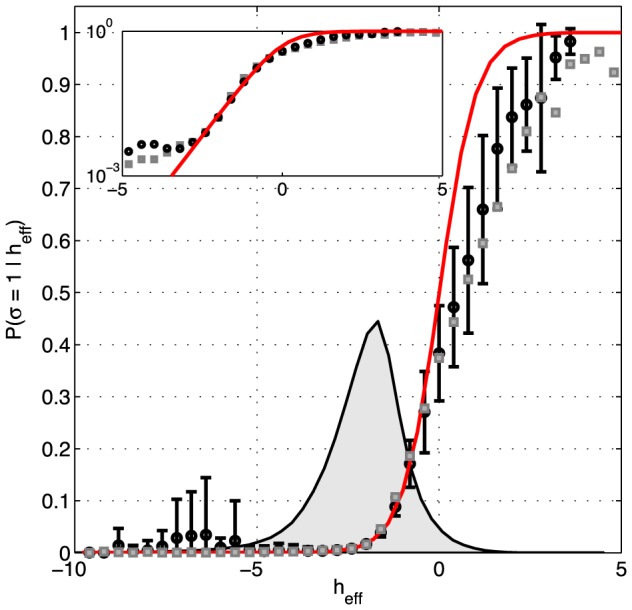
Figure 9. Effective field and spiking probabilities in a network of N = 120 neurons.

Given any configuration of  neurons, the K-pairwise model predicts the probability of firing of the N-th neuron by Eqs (25,26); the effective field
  is fully determined by the parameters of the maximum entropy model and the state of the network. For each activity pattern in recorded data we computed the effective field, and binned these values (shown on x-axis). For every bin we estimated from data the probability that the N-th neuron spiked (black circles; error bars are s.d. across 120 cells). This is compared with a parameter-free prediction (red line) from Eq (26). For comparison, gray squares show the analogous analysis for the pairwise model (error bars omitted for clarity, comparable to K-pairwise models). Inset: same curves shown on the logarithmic plot emphasizing the low range of effective fields. The gray shaded region shows the distribution of the values of
  over all 120 neurons and all patterns in the data.
