
Figure 10. The number of identified metastable patterns.
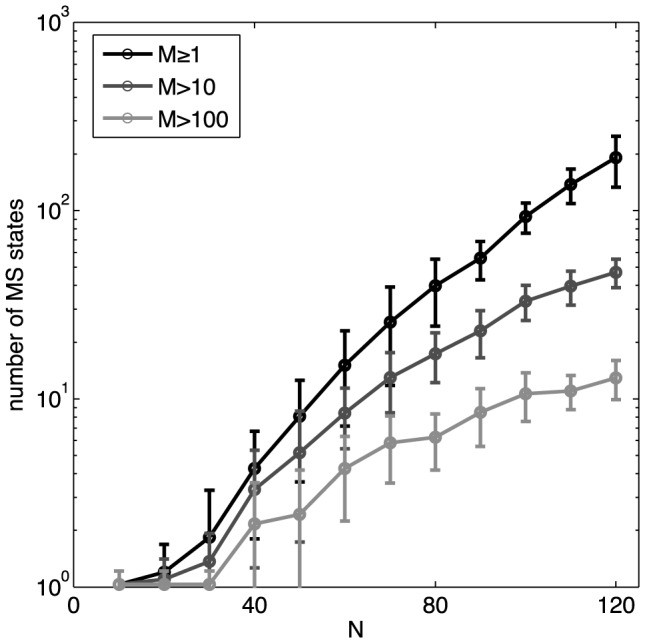
Every recorded pattern is assigned to its basin of attraction by descending on the energy landscape. The number of distinct basins is shown as a function of the network size, N, for K-pairwise models (black line). Gray lines show the subsets of those basins that are encountered multiple times in the recording (more than 10 times, dark gray; more than 100 times, light gray). Error bars are s.d. over 30 subnetworks at every N. Note the logarithmic scale for the number of MS states.