
Figure 11. Energy landscape in a N = 120 neuron K-pairwise model.
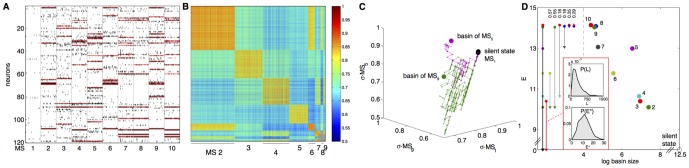
(A) The 10 most frequently occurring metastable (MS) states (active neurons for each in red), and 50 randomly chosen activity patterns for each MS state (black dots represent spikes). MS 1 is the all-silent basin. (B) The overlaps,  , between all pairs of identified patterns belonging to basins 2,…,10 (MS 1 left out due to its large size). Patterns within the same basin are much more similar between themselves than to patterns belonging to other basins. (C) The structure of the energy landscape explored with Monte Carlo. Starting in the all-silent state, single spin-flip steps are taken until the configuration crosses the energy barrier into another basin. Here, two such paths are depicted (green, ultimately landing in the basin of MS 9; purple, landing in basin of MS 5) as projections into 3D space of scalar products (overlaps) with the MS 1, 5, and 9. (D) The detailed structure of the energy landscape. 10 MS patterns from (A) are shown in the energy (y-axis) vs log basin size (x-axis) diagram (silent state at lower right corner). At left, transitions frequently observed in MC simulations starting in each of the 10 MS states, as in (C). The most frequent transitions are decays to the silent state. Other frequent transitions (and their probabilities) shown using vertical arrows between respective states. Typical transition statistics (for MS 3 decaying into the silent state) shown in the inset: the distribution of spin-flip attempts needed, P(L), and the distribution of energy barriers,
  , over 1000 observed transitions.